+ محدودیت زمان: ۱ ثانیه
+ محدودیت حافظه: ۲۵۶ مگابایت
----------
Amin records the price of his stock every now and then as a data point $(t_i, p_i)$ in his notebook, where $p_i$ is the price of his stock at day $t_i$. The sequence of these data points represents a piecewise-linear function $F$ displaying the history of prices over a period of time. Indeed, $F$ connects every pair of consecutive points by a straight line segment. If the price is not recorded for some day $t$, $F(t)$ can be used as an estimate instead. His collected data is getting larger and larger as he has been tracking the price of his stock over a long period of time. Therefore, he has decided to reduce his data by throwing away some of his recoded data points and constructing a new piecewise-linear function $F$′ with the remaining points. $F$′ is a so-called “simplification” of $F$. Amin wants to create the simplification in such a way that $F$′ is a good approximation for $F$. To this end, he has defined an error measure as follows.
Let $F$ be defined over a strictly increasing sequence $L = \langle t_1, \dots, t_n \rangle$ of days, and $F'$ be defined over a subsequence $L' = \langle t'_1, \dots, t'_m \rangle$ of $L$, where $t'_1 = t_1$, $t'_m = t_n$, and $F'(t'_i) = F(t'_i)$ for $1 \leq i \leq m$. (We call $m$ the size of $F'$.) The error of $F'$ is defined as the maximum of $|F'(t_k) - F(t_k)|$ for all $1 \leq k \leq n$.
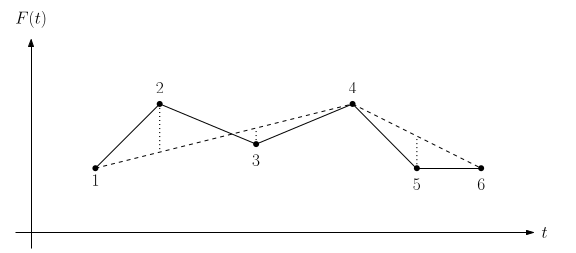
For example, in the following figure, we have $6$ data points, labeled $1$ through $6$, whose coordinates are the same as those presented in the second sample input, and $F'$ is a simplification of $F$ of size $3$ with data points $1$, $4$, and $6$. In this figure, $F$ is depicted by solid lines, and $F'$ by dashed lines. The error measure for $F'$ is realized by the vertical distance of point $2$ to $F'$.
Amin’s goal is to minimize the size of $F'$ , while the error of $F'$ is bounded by a given value $\delta$.
# ورودی
The first line of input contains a positive integer $n$ ($2 \leq n \leq 2000$) that shows the size of $F$. Each of the next $n$ lines contains two integers $t_i$, $p_i$ ($1 \leq t_i,p_i \leq 10^6$), where $p_i$ is the price of the stock at day $t_i$. The last line contains the error limit $\delta$ which is a non-negative integer at most $10^6$.
# خروجی
In the output, print the minimum possible size of $F'$.
# مثالها
## ورودی نمونه ۱
```
3
1 10
3 100
10 20
90
````
## خروجی نمونه ۱
```
2
````
## ورودی نمونه ۲
```
6
10 10
20 20
35 14
50 20
60 10
70 10
8
````
## خروجی نمونه ۲
```
3
````
C - Simplification
ارسال پاسخ برای این سؤال
در حال حاضر شما دسترسی ندارید.